Add the following:
INTRODUCTION
Identification of botanical articles can be achieved by the application of multiple techniques, including macroscopic and microscopic descriptions, DNA analysis, and chemical means. Identification of Articles of Botanical Origin  563
563 provides a detailed discussion of these approaches. Chemical identification typically employs chromatographic or spectroscopic procedures to achieve the identification by fingerprint comparison against that of a Reference Standard, monograph description, or a reference chromatogram. Thin-layer chromatography (TLC) is one of the chromatographic techniques used in USP monographs for botanical articles in this way. High-performance thin-layer chromatography (HPTLC) is the most advanced version of TLC (see Chromatography
  621
621 ), and a general analytical procedure for the application of HPTLC to the identification of botanicals is described in High-Performance Thin-Layer Chromatography Procedure for Identification of Articles of Botanical Origin
  203
203 . In HPTLC, the stationary phase consists of a uniform, typically 200-µm layer of porous (pore size 60
  ), irregular particles of silica gel with a size between 2 and 10 µm and an average particle size of 5 µm, plus a polymeric binder and a fluorescence indicator (F254) coated onto a support, which is typically a glass plate or aluminum foil. Other stationary phases, such as chemically bonded phases (C8, C18, CN, NH2; DIOL) or microcrystalline cellulose, are also available with and without a fluorescence indicator. Because of the greater separation efficiency of the fine particles in HPTLC, the chromatographic system is miniaturized, using smaller developing chambers and shorter developing distances of 6–8 cm, in comparison to classical TLC, where 12–15 cm are required for best separation. As a consequence, less mobile phase and less time are required for chromatogram development. Another effect of miniaturization is the use of smaller sample volumes and the resulting possibility of analyzing more samples per plate than in classical TLC.
In addition, improved layer quality due to smaller particle size positively affects the signal-to-noise ratio, and therefore affects the detectability of separated sample components. A system suitability test is used to qualify the results. This feature is of great importance for the identification of botanical ingredients, which have an intrinsic natural variability in chemical composition. HPTLC features electronic images of chromatograms that allow convenient visual comparison of results obtained for multiple samples against images of chromatograms generated with reference materials. For purposes of identification, the complexity of botanical ingredients is best represented by fingerprints obtained in multiple detection modes from the same chromatogram, e.g., UV 254 nm and UV 366 nm light without derivatization, and white and UV 366 nm light after derivatization. Because compendial methods are used to determine compliance, variability in the results caused by the analytical method selected should be avoided. Because HPTLC can control the variables within narrow ranges using a rigorously standardized methodology and appropriate equipment, HPTLC is able to increase significantly the reproducibility of a chromatographic result from plate to plate compared to traditional TLC. Following here is a discussion of the variables to be controlled in order to achieve reproducible results in the identification of articles of botanical origin using HPTLC.
VARIABLES OF HPTLC
The plate is an open system affected by environmental factors, which must be controlled carefully. Unlike column chromatography, a closed system where samples are analyzed sequentially, in HPTLC multiple samples can be analyzed in parallel on the same plate. All steps of the planar chromatographic process are independent in time and location (an off-line process). For each of the steps—sample application, chromatogram development, visualization, detection, documentation, and evaluation—numerous parameters can be selected freely. This unique feature adds immense flexibility to the method and makes the planar chromatographic approach complementary to column-based techniques.
During method development, the many choices available for the various parameters can be overwhelming, and depending on the combination selected, there may be multiple results that all meet the respective analytical goal and yet are quite different. In this scenario, the labels “better” or “worse” are often assigned to the parameters according to personal preferences. In a cGMP (current Good Manufacturing Practices)-compliant environment, the reproducibility and integrity of results are of great importance. This is why the individual parameters of the HPTLC technique should be selected and combined thoughtfully in a standardized methodology so that the final result is optimized and can be compared to results obtained by different analysts. It may be important to avoid cumbersome and time-consuming steps, or to avoid the use of hazardous or toxic chemicals. Simplicity and clarity are desirable aspects of practical methods.
Handling of Plates
HPTLC plates are delicate and must be handled with care to avoid damaging the layer. When moving the plate, it should be touched only in the upper part above the region of chromatography. Each plate should be labeled with a soft pencil in the upper right (or left) corner. The expected developing distance can be marked on the right (or left) edge with a short pencil mark that goes down to the glass support. Marking the developing distance across the entire plate should be avoided because it is difficult to judge when the rather-diffuse mobile phase front reaches that line. Aligning the front with a short mark on the edge is easier.
Plates should be stored in a place that is free of fumes and dust with the layer facing down to the stack. Shrink wrap of the package should not be in contact with the layer in order to avoid contamination with volatiles from the foil. Generally, HPTLC plates are ready for use without any pretreatment. Older or improperly stored plates may have accumulated impurities and therefore require precleaning. This is the case when after development, the solvent front (or additional secondary fronts) can be seen under UV 254 nm as an intense, broad dark band across the plate. Precleaning can be achieved by developing the plate in methanol to the upper edge. Subsequently, the plate is dried in a clean oven at 120 for 20 min. For cooling down to room temperature and for storage prior to further use, plates can be kept in an empty desiccator or wrapped in aluminum foil. Precleaning may slightly change the selectivity of a plate. Therefore, it is important to define in a method whether or not precleaned plates are to be used. Precleaning with the mobile phase is usually not a good option because it may be difficult to completely remove all components during the drying step.
Plate Layout and Sample Application
The standard format of the HPTLC plate is 20 × 10 cm (width × height). Other sizes (e.g., 10 × 10 cm) could be used as well, but one should keep in mind that for obtaining reproducible results, each size of plate requires a different chamber to maintain the same geometrical aspects as, for example, a twin-trough chamber would have for the standard plate (see Chromatogram Development). The optimum developing distance in HPTLC is 6 cm. Cutting plates to less than 10 cm in height provides no additional advantages.
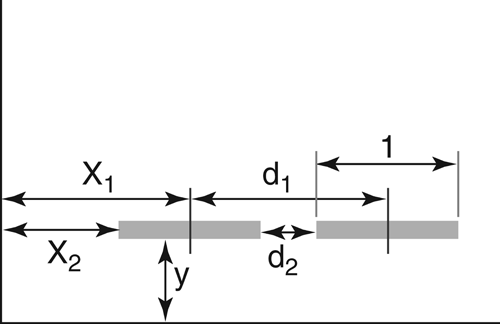
Exact positioning is essential for proper identification of separated zones. For the application of samples with respect to plate layout (Figure 1), the following parameters must be considered.
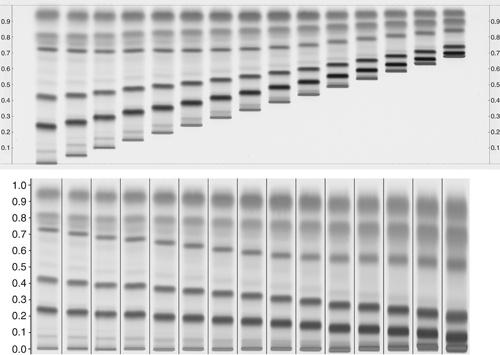
For proper identification (migration distance/RF values), all samples must be applied on a (virtual) line parallel to the lower edge of the plate. The distance (y) must be large enough to avoid the sample being immersed in the developing solvent. During development, the velocity of the mobile phase decreases with increasing developing distance. Consequently, the final result depends on the application position relative to the level of developing solvent (Figure 2).
Figure 2. Upper part: Effect of the application position relative to the level of developing solvent (5 mm). Distance from lower edge ranges from 8–50 mm in increments of 3 mm. Lower part: RF values calculated for the different effective developing distances. Sample is Houttuyniae herba; developing solvent is a combination of ethyl acetate, formic acid, and water (15:1:1, v/v/v); derivatization is Natural Products reagent (NP); detection is UV 366 nm.
For reproducible results, the distance from the lower edge (y) must be kept constant, and the amount of developing solvent placed into the chamber must also be fixed. To minimize solvent consumption, twin-trough chambers are used. The level of developing solvent in such chambers is typically 5 mm. A meniscus is formed on the plate at the immersion line. A sample applied at y = 8 mm will be well above this meniscus.
The distance of the application position from the left and right edges of the plate (x) must be sufficient to avoid the so-called “edge effect” (Figure 3). During production, most precoated plates develop a small rim on their edges where the layer is slightly thicker. This causes the mobile phase to advance faster, and samples that are applied directly onto or too close to the rim will migrate unevenly.
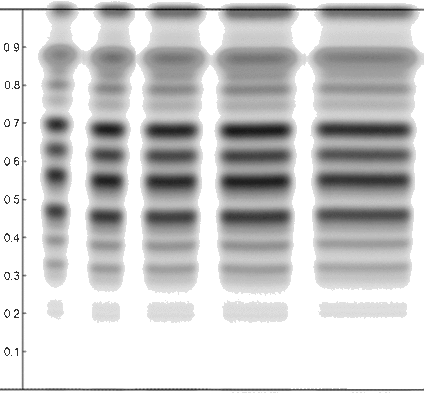
The position x1 is typically called “application position”. In order to avoid the edge effect, the length of the applied band (l) has to be taken into account when defining x2 as the distance from the edge of the plate. A minimum of 15 mm is necessary for x2. The distance between two samples (d1) also considers the band length (l). For d2, a minimum of 3 mm is recommended so that samples do not interfere with each other if larger volumes are applied. The band length (l) must be fixed for each method because it affects the concentration of samples per band if a defined volume of sample solution is applied. The applied quantity (across a defined band length) has an effect on the intensity of the separated zones and may affect whether or not a particular zone of a fingerprint is visible. An argument for selecting shorter bands would be that more samples can be applied on the plate. However, because chromatogram evaluation is primarily performed visually, it has to be noted that a band seems to look “sharper” (more like a band and less oblong) when it is >5 mm (Figure 4). A band length of 8 mm is a good compromise also from the perspective that  621
621 specifies bands of 5–10 mm for HPTLC plates.
Figure 4. Effect of band length on the visual impression of separation. From left to right, 3 µL/3 mm, 5 µL/5 mm, 8 µL/8 mm, 11 µL/11 mm, and 15 µL/15 mm. Sample is Tiliae flos; developing solvent consists of ethyl acetate, formic acid, water, and methyl ethyl ketone (50:10:10:30, v/v/v/v); derivatization is NP/Polyethylene glycol reagent (PEG); detection is at UV 366 nm.
With the parameters just discussed, the standard plate layout will feature 15 bands of 8-mm length. If fewer samples are to be analyzed, it is recommended to either apply replicates or leave some tracks on the plate blank.
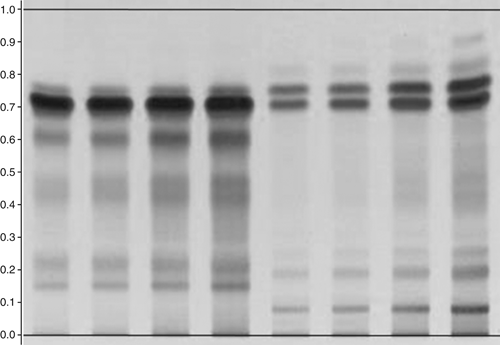
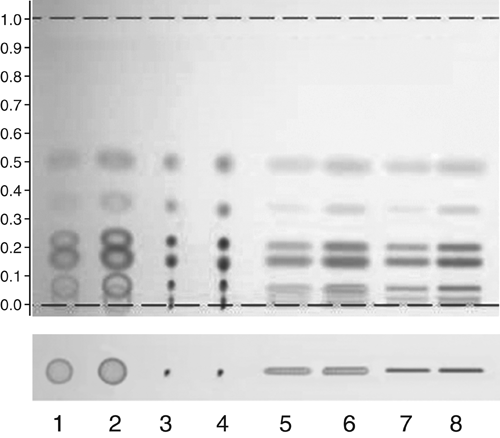
During application, samples are precisely deposited onto the HPTLC plate at defined positions and in defined quantities. Sample solutions can be applied by contact using a capillary or a syringe, or by spraying the sample solution without touching the plate (spray-on technique). During contact application, the sample's solvent can perform circular chromatography (Figure 5). Therefore, only small volumes should be applied in one stroke, and if possible, only nonpolar solvents should be used. During spray-on application, the sample's solvent is nebulized and evaporated, creating sharp zones regardless of the polarity of the solvent.
If samples are applied manually, a spotting guide can be used for proper positioning. Marking the application position with a pencil is not a good option, because the layer can be damaged easily.
Figure 5. Lower part: Sample application as spot (tracks 1–4) and band (tracks 5–8) using contact application (tracks 1, 2, 5, 6) or spray-on technique (tracks 3, 4, 7, 8); application volumes were 2 µL (tracks 1, 3, 5, 7) or 5 µL (tracks 2, 4, 6, 8); test dye mixture in methanol. Upper part: Chromatography with toluene as mobile phase.
Chromatogram Development
The processes in a chromatographic chamber are highly complex and difficult to describe. Unlike column chromatography, which is assumed to take place in equilibrated chromatographic systems, planar chromatography always begins in a state of nonequilibrium and never reaches equilibrium. The sample has been applied onto the plate, which becomes the stationary phase only when it comes in contact with a liquid in the chromatographic chamber. The advancing mobile phase must be able to dissolve the sample for chromatography to begin. Driven by capillary action, the mobile phase velocity decreases with increasing migration distance because the resistance of the stationary phase against the flow is also increasing.
It can be shown experimentally that the optimum migration distance for mobile phases on HPTLC plates is about 6 cm. Depending on the viscosity of the mobile phase, development takes place between 10 and 20 min. To further move the solvent front just 10 mm will extend the developing time by 5–15 min, while moving an additional 20 mm will increase the developing time by 15–40 min. The contribution of that extra developing distance to improved separation is usually not justifiable, because the diffusion that occurs at decreased velocity of the mobile phase often offsets any gain in distance of separated zones.
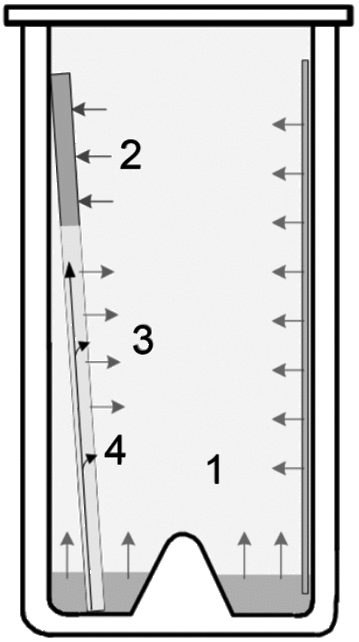
Four distinct processes occur in a chromatographic chamber. These processes always take place simultaneously and affect each other (Figure 6).
Figure 6. Processes occurring in the chromatographic chamber (twin-trough chamber): (1) chamber saturation; (2) plate preconditioning; (3) evaporation; (4) formation of secondary fronts.
Chamber saturation (Figure 6, process 1) is usually established before placement of the plate into the chamber. The developing solvent, which has a known composition, is placed into both troughs of the chamber, and the filter paper in the rear trough is wetted thoroughly. Chamber saturation occurs once the liquid in the tank is in equilibrium with its own vapor, and this is a function of time. After 20 min, the chamber will generally achieve a reproducible degree of saturation.
The plate should be placed into the chamber so that it rests in a vertical position against the front wall while the layer faces the rear wall. The dry portion of the layer absorbs solvent vapor from the gas phase (process 2) in order to achieve adsorptive saturation, which occurs when the surface is covered by a layer of solvent molecules. Generally, this process can lower RF values and also affect the selectivity of the separation. In the lower portion of the plate, the liquid in the chamber forms the mobile phase. Depending on the degree of saturation, a part of the mobile phase may evaporate off the plate (process 3). Multicomponent mobile phases may be separated by the stationary phase because of different interactions of the constituents. This process is affected by the degree of preconditioning.
In an unsaturated chamber, the situation is quite different. The rear trough does not contain liquid or filter paper. The plate is introduced immediately after the solvent, which does not allow enough time to achieve gas–liquid saturation equilibrium. Preconditioning has little effect, while evaporation and possibly formation of secondary fronts (process 4) dominate the chromatographic process. Both of these processes typically cause alterations in the chromatograms, thereby affecting the separation.
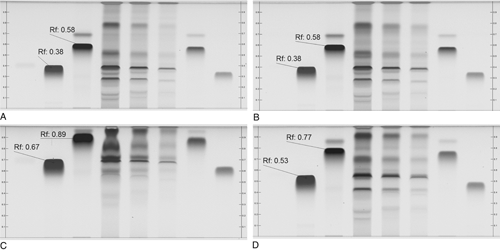
In conclusion, each chamber gives a somewhat different result, depending on the chamber's geometry, the presence or absence of liquid and filter paper in one of the troughs, and the waiting time before introducing the plate. The chromatograms shown in Figure 7 were obtained with an automatic developing chamber with humidity control. In this example, a saturated chamber (A) gives better separation than an unsaturated chamber (C). Chromatograms are reproducible if all conditions are the same (A) and (B). If the filter paper for saturation is not exchanged but is reused without drying, a completely different result is obtained (D).
Figure 7. Effects of different chamber configurations at relative humidity 33%: (A) and (B) are saturated, (C) is unsaturated, and (D) is saturated with reused filter paper. Sample is Lapsana communis, references are chlorogenic acid (RF 0.38, Lane 1, Panel A), quercitrine (RF 0.58, Lane 2, Panel A), developing solvent: water, methanol, glacial acetic acid, and methylene chloride (2:3:8:15, v/v/v/v); derivatization NP/PEG; detection UV 366 nm.
For reproducible results, it is necessary to carefully standardize the development step. Chamber saturation is easy to achieve, as is proper timing. Unsaturated chambers are extremely sensitive to small changes and therefore, from a practical point of view, they should be avoided, even if they can give “better” separation. It is a good practice to keep developing distances constant (at optimum) for all methods, because other parameters, such as selectivity and condition of the gas phase, affect separation to a much greater degree.
Drying
After the mobile phase has advanced the desired distance, the plate must be removed from the chamber and reproducibly dried. This is best achieved by exposing the plate in the vertical position to a flow of cold air. Elevated temperature during drying could cause volatile sample components to diffuse or evaporate from the plate. During the evaporation of the mobile phase, sample components move from deeper areas of the layer to the surface. Uneven drying across the plate may result in different intensities for zones with equal amounts of substances.
Effects of Humidity
Silica gel has an extremely high affinity for water and is an effective drying agent. An HPTLC plate is always at equilibrium with the water vapor in the laboratory atmosphere (relative humidity, RH). Chromatographic results are affected by variation in the amount of water adsorbed onto the silica gel surface. The higher the RH, the more water is adsorbed. In a first approximation, this reduces the “activity” of the stationary phase and causes higher RF values. Also, because the adsorbed water can become part of the stationary phase, the selectivity of the chromatographic system often changes in response to variation in RH.
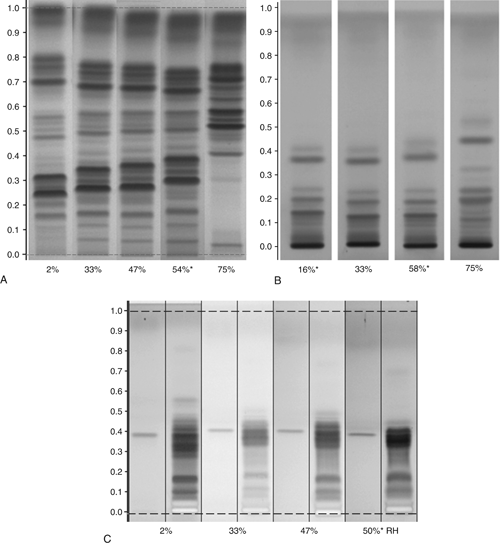
Unfortunately, it is nearly impossible to predict what effect a change in RH may have for a given separation (Figure 8). Some separations are more affected than others, and sometimes only parts of the chromatogram will change. In addition, there is no ideal activity of the plate that can solve all separation problems, and it is difficult to use defined activity changes of the stationary phase to influence separation in a desired way. The best option is to keep the RH constant at a moderate level (e.g., 33%) and then, try to adjust the selectivity of the mobile phase. One practical exemption is effective “drying off” of the plate using a molecular sieve. Activating a plate by heat (120 for 20 min) is possible, because under these conditions water adsorbed onto the silica gel is effectively removed, but when the plate is cooled down and stored, or during sample application it re-equilibrates to ambient relative humidity.
Figure 8. Effects of relative humidity on the separation of different samples. (A) Hoodia gordonii, developing solvent: chloroform, methanol, and water (70:30:3, v/v/v); derivatization: anisaldehyde reagent, detection white light. (B) Licorice root, developing solvent: ethyl acetate, formic acid, acetic acid, and water (15:1:1:2, v/v/v/v); derivatization: sulfuric acid reagent, detection white light. (C) Actein/Black cohosh rhizome, developing solvent: toluene, ethyl formate, and formic acid (5:3:2, v/v/v); derivatization: sulfuric acid reagent, detection UV 366 nm. Humidity: *ambient; 2%: molecular sieve; 33%: saturated solution of magnesium chloride (MgCl2); 47%: saturated solution of potassium thiocyanate (KSCN); 75%: saturated solution of sodium chloride (NaCl).
To achieve reproducible results independent of seasonal or regional changes in the RH in various laboratories, it is important to expose the plate to a defined RH before development and with the samples already applied. This will keep the activity and the selectivity of the stationary phase constant. Defined RH can be created in closed containers such as a desiccator over saturated salt solutions. Between 20 and 25
 , saturated solutions of magnesium chloride establish 33% RH; of potassium thiocyanate (KSCN), 47% RH; and of sodium chloride (NaCl), 75% RH.
Derivatization, Detection, and Evaluation
The possibility of convenient chemical derivatization of substances already separated on a plate is an outstanding advantage of planar chromatography. Solutions of derivatizing reagents can be applied onto the plate, either by spraying or immersion. For reproducible results, the amount of reagent of a given concentration applied needs to be defined either by volume (spraying) or by volume, and dwell time (immersion). Most derivatization reactions require a heating step performed either on a plate heater or in a drying oven. The plate should be dried in air before heating to avoid any disruption of the layer resulting from evaporation of residual solvent. Before the plate is heated, the heating device should reach the required temperature. For reproducible results, it is important that the entire derivatization process is strictly timed. This includes any waiting time (e.g., for cooling) before the detection step.
Detection is performed under white light, typically by using a light source above the plate (reflectance) in combination with light from below the plate (transmission). Additional information (typically before any chemical derivatization) can be obtained under UV 254 nm. The F254 indicator of the HPTLC plate will emit a green light (blue for F254s). Any substance that absorbs UV 254 nm will be visible as a dark “quenching” zone where the degree of quenching corresponds to the amount of that substance (and its extinction coefficient). Some substances can be excited to fluoresce by UV 366 nm, particularly after chemical derivatization. Such substances are seen as zones of specific colors on the dark background.
HPTLC benefits from digital images taken of the plate in different detection/illumination modes. Such images may sometimes look different from what the analyst's eye is seeing. This is due to some physical limitations, but it is possible to standardize the imaging process so that “true” data are generated. These parameters should always be the same for a given plate regardless of where and by whom the image is taken. The use of image editing software to change certain aspects is not permissible.
In the evaluation step, the analytical data obtained for a sample are compared against specifications of the method. HPTLC for identification of botanical ingredients typically produces fingerprints, i.e., sequences of zones that have specific positions, colors, and intensity. Those fingerprints are compared against data obtained with reference materials. Ideally, comparison is based on images rather than descriptions. Because of the natural variability of botanical materials, there will always be a range associated with the acceptance criteria for a fingerprint to pass the identity test. Fingerprints of different species (adulterants) should have distinguishing features not present in samples that pass the evaluation (Figure 9). It is necessary to include a range of botanical reference materials covering different accessions when defining the acceptance criteria for identification. Multiple detection modes are helpful in making decisions.
System Suitability
Before evaluating and/or comparing data that originate from different HPTLC plates, each developed plate must be qualified. This is possible with a system suitability test, which is part of the analytical method. On each plate, the analyst selects two or more reference substances that have similar but just separable RF values under the chromatographic conditions to be used [e.g., chlorogenic acid (blue) and hyperoside (yellow-orange) in chromatographic systems used for flavonoids]. The substances designated to check the system suitability for resolution, position, and colors of the bands may be included in reference standard extracts or another matrix. Description of the resolution position and colors for the key bands of the reference material fingerprint should match the description in the reference within a specified tolerance range. Only when the system suitability requirements have been satisfied can the results obtained with the samples on the same plate be evaluated further to determine compliance. For reference to a standardized procedure for identification of articles of botanical origin controlling the variables described in this chapter, see  203
203 .
.
CONCLUSIONS
As HPTLC is widely used for botanical identification to monitor the quality of articles of botanical origin on an increasingly globalized level, it seems important to thoroughly standardize the involved analytical procedures. All parameters discussed above must always be selected for each HPTLC analysis. Currently laboratories in different countries can make this selection widely within the framework of the USP general chapters; however, guidance about how to achieve specific HPTLC results in a reproducible manner is not available. A standardized procedure as proposed in  203
203 could fill this gap and serve as basis for harmonization of results obtained in different laboratories.
 1S (USP38)
Auxiliary Information—
Please check for your question in the FAQs before contacting USP.
| Topic/Question | Contact | Expert Committee |
|---|---|---|
| General Chapter | Nandakumara D Sarma, Ph.D.
Director, Dietary Supplements (301) 816-8354 |
(GCCA2010) General Chapters - Chemical Analysis |
USP38–NF33 Supplement : No. 1 Page 7081
Pharmacopeial Forum: Volume No. 40(3)


