SCOPE
The scope of this general chapter is to provide general information for performance testing of semisolid drug products, various types of equipment employed for such testing, and potential applications of the performance testing.
PURPOSE
This chapter provides general information about performance testing of semisolid drug products, the theory and applications of such testing, information about the availability of appropriate equipment, and likely developments in performance testing of semisolid drug products. General chapter Topical and Transdermal Drug Products—Product Quality Tests  3
3 provides information related to product quality tests for topical and transdermal dosage forms, Drug Release
  724
724 provides procedures and details for testing drug release from transdermal systems, and this chapter
  1724
1724 provides procedures for determining drug release from semisolid dosage forms.
INTRODUCTION
This chapter provides general information for in vitro testing of semisolid drug products. Semisolid dosage forms include creams, ointments, gels, and lotions. Semisolid dosage forms may be considered extended-release preparations, and their drug release depends largely on the formulation and manufacturing process. The release rate of a given product from different manufacturers is likely to be different.
DRUG PRODUCT QUALITY AND PERFORMANCE TESTS
A USP drug product monograph contains tests, analytical procedures, and acceptance criteria. Drug product tests are divided into two categories: (1) those that assess general quality attributes, and (2) those that assess product performance, e.g., in vitro release of the drug substance from the drug product. Quality tests assess the integrity of the dosage form, but performance tests, such as drug release, assess attributes that relate to in vivo drug performance. Taken together, quality and performance tests are intended to ensure the identity, strength, quality, purity, comparability, and performance of semisolid drug products.
Details of drug product quality tests for semisolid drug products can be found in chapter  3
3 . Product performance tests for semisolid drug products are conducted to assess drug release from manufactured pharmaceutical dosage forms. In vitro performance tests for semisolid products do not, however, directly predict the in vivo performance of drugs, as the primary factor that impacts bioavailability and clinical performance are the barrier properties of the epithelia to which the product is applied (epidermal or mucosal tissues). Although product performance tests do not directly measure bioavailability and relative bioavailability (bioequivalence), they can detect in vitro changes that may correspond to altered in vivo performance of the dosage form. These changes may arise from changes in physicochemical characteristics of the drug substance and/or excipients or to the formulation itself, changes in the manufacturing process, shipping and storage effects, aging effects, and other formulation and/or process factors.
At present, a product performance test is available to evaluate in vitro drug release for creams, ointments, lotions, and gels. Several available apparatus can be used for this evaluation, including the vertical diffusion cell, immersion cell, and a special cell used with USP Apparatus 4. Because of the significant impact of in vitro test parameters, such as release media, porous membrane and dosing, and the interaction of these parameters with a given drug product, the primary use of in vitro drug release testing is comparison testing in which any difference in delivery rate is undesirable. Drug release testing is most suitable for evaluation of small formulation and process changes, manufacturing site changes, and stability testing. The evaluation or comparison of large formulation changes may provide unmeaningful results, unless extensive validation is performed to select test parameters that ensure that the sensitivity of the test is meaningfully correlated with in vivo performance. The only required regulatory use of the in vitro release test is to determine the acceptability of minor process and/or formulation changes in approved semisolid dosage forms (see FDA Guidance for Industry—Nonsterile Semisolid Dosage Forms—Scale-Up and Postapproval Changes: Chemistry, Manufacturing, and Controls; In Vitro Release Testing and In Vivo Bioequivalence Documentation; available at http://www.fda.gov/downloads/Drugs/GuidanceComplianceRegulatoryInformation/Guidances/UCM070930.pdf).
This chapter provides general information for testing in vitro performance of semisolid drug products.
IN VITRO PERFORMANCE TESTS
Theory
The diffusion cell is a reliable and reproducible means of measuring drug release from semisolid dosage forms. A thick layer of the semisolid product under evaluation is placed in contact with a medium in a reservoir, and the latter acts as a receptor when the drug substance diffuses through the formulation, across the membrane, and into the reservoir. Diffusion occurs across an inert, highly permeable support membrane. The membrane is intended to keep the product and the receptor medium separate and distinct. Membranes should offer the least possible diffusional resistance and should not be rate controlling. Samples are withdrawn from the receptor chamber, typically at 1-h intervals over a 4–6 h period.
After a short lag period, release of drug from the semisolid dosage form is kinetically described by diffusion of a chemical out of a semi-infinite medium into a sink. The momentary release rate tracks the depth of penetration of the forming gradient within the semisolid. Beginning at the moment when the receding boundary layer's diffusional resistance assumes dominance of the kinetics of release, the amount of the drug released, m, becomes proportional to  t (where t = time) for solution, suspension, or emulsion semisolid system alike. The momentary rate of drug release, dm/dt, becomes proportional to 1/
 t, which reflects the slowing of drug release with the passage of time. The reservoir is kept large so that over the entire course of the experiment, the concentration of the drug released into a medium remains highly dilute relative to the concentration of drug dissolved in the semisolid. In these circumstances, drug release is said to take place into a diffusional sink.
When a drug is totally in solution in the dosage form, the amount of drug released as a function of time can be described by Equation 1:
where m is the amount of drug released into the sink per cm2, C0 is the drug concentration in the releasing matrix, and D is the drug diffusion coefficient through the matrix.
A plot of m versus  t will be linear with a slope of:
Equation 2 describes drug release when the drug is in the form of a suspension in the dosage form:
where Dm is the drug diffusion coefficient in the semisolid matrix, CS is the drug solubility in the releasing matrix, and Q is the total amount of the drug in solution and suspended in the matrix. When Q >> CS, Equation 2 simplifies to Equation 3:
A plot of m versus  t will be linear with a slope of:
Coarse particles may dissolve so slowly that the moving boundary layer recedes to some extent behind the particles. That situation introduces noticeable curvature in the  t plot because of a particle size effect.
During release rate experiments, reasonable attempts should be made to keep the composition of the formulation intact over the releasing period.
Drug Release Rate Determination Using Vertical Diffusion Cell Apparatus
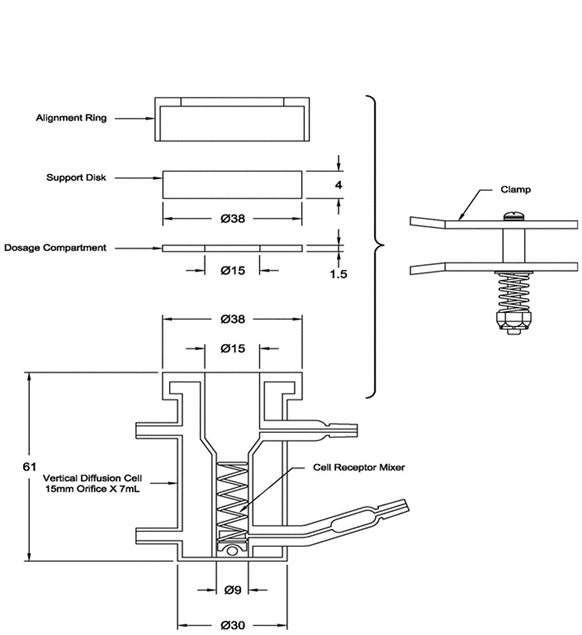
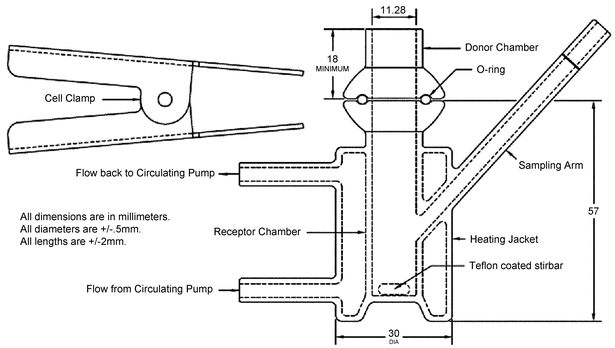
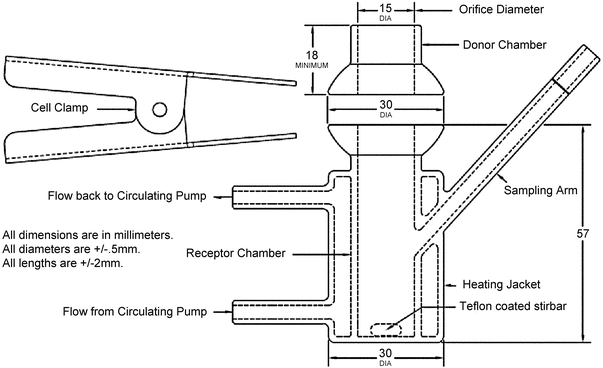
Many vertical diffusion cell (VDC) systems are composed of 6-cell units. Each VDC cell assembly consists of two chambers (a donor chamber and a receptor chamber) separated by a membrane and held together by a clamp, screw top, or other means (see Figure 1–Model A, Figure 2–Model B, and Figure 3–Model C). Other diffusion cells that are similar in general design also can be used. In the donor chamber, the semisolid dosage form sample sits on a synthetic, inert, highly permeable support membrane. For the VDC Model A, the sample sits on the support membrane within the cavity of the sample chamber covered with a glass disk.
Typically, amounts of the semisolid sample NLT 200 mg are used. Diffusive communication between the semisolid sample and the reservoir takes place through the support membrane. The membrane is intended to keep the drug product sample and receptor medium separate and distinct. A heating jacket or a suitable device should be used to maintain the temperature within the cell. The release rate experiment is carried out at 32 ± 1 , except in the case of vaginal drug products for which the temperature should be 37 ± 1
 . Usually a set of 6 cell assemblies are operated together at one time (i.e., single run). Sampling generally is performed over a 4–6 h time period, and the volume withdrawn is replaced with stock receptor medium. To achieve sink condition, the receptor medium must have a high capacity to dissolve the drug, and the drug concentration in the receptor medium at the end of the test ideally should be as low as possible. For each cell, the amount of drug released (µg/cm2) at each sampling time (t1, t2, etc.) is determined, and the cumulative amount released plotted versus
  t. The slope of the resulting line is a measure of the rate of drug release. The test is often conducted with a group of 6 or 12 cells per test run. The average of 6 slopes for each test and reference product is a measure of the drug release rate from the dosage form.
Figure 1. Vertical diffusion cell–Model A (All dimensions are in mm. All diameters are ±0.5 mm. All lengths are ±2 mm).
Figure 2. Vertical diffusion cell–Model B (All dimensions are in mm. All diameters are ±0.5 mm. All lengths are ±2 mm).
Figure 3. Vertical diffusion cell–Model C (All dimensions are in mm. All diameters are ±0.5 mm. All lengths are ±2 mm).
The VDC body (i.e., donor and receptor chambers) usually is made from borosilicate glass, although different materials may be used to manufacture the body and other parts of the VDC assembly. It is recommended that the cell assembly materials should not significantly react with, adsorb to, or absorb the test product or samples. The semisolid dosage form is placed on a membrane within the cavity of the dosage chamber that can be occluded. The diameters of the orifices of the donor chamber and receptor chamber, which define the dosage delivery surface area for the test, should be sized within ±5% of the specified diameter. The diameter of the donor and receptor chamber orifices may vary depending on the application. The receptor chamber orifice should never be smaller than the orifice of the donor chamber but should be fabricated to the same size as the donor chamber orifice. The design of the VDC should facilitate proper alignment of the donor chamber and the receptor orifice. The receptor chamber should be manufactured consistently with uniform height and geometry. All the cells should have the same nominal value, and the true volume should be measured for each individual cell. Care should be taken to minimize the intercell volume variability.
For the test, the VDC units are typically positioned in a stirrer rack (not depicted) that holds multiple VDC units (e.g., in sets of 6) in the correct orientation, providing magnetic stirring at a calibrated rate and facilitating the supply of circulating heated water flow to the water jacket of the VDC. The VDC rack is typically connected to a thermostatically controlled water bath recirculator.
The water from the circulating pump flows into the VDC heating jacket from the lower port and flows out from the upper port to facilitate the removal of any air bubbles formed in the heating jacket. A magnetic nonstick (Teflon-coated) stirring bar in the receptor chamber is used as the internal stirring mechanism. Aliquots of the receptor medium are drawn via the sampling arm at intervals throughout the test, and an equivalent volume of stock receptor medium replaced to the level of the calibration mark on the sampling arm.
model a
The thickness of the sample chamber normally is 1.5 mm. This thickness should be sized within ±10% of the specified thickness. The glass support disk is used to occlude the semisolid dosage form. A receptor cell mixer and stirrer magnet are used as the internal stirring mechanism.
Test Procedures: General
Before initiating testing, analysts should determine the volume of each VDC with the internal stirring device in place. During the entire test, the temperature of the receptor medium should be maintained at 32 ± 1 , or 37 ± 1
 for vaginal preparations. The rotational stirring rate tolerance should be ±10% of the rate in the method (normally 600 rpm). The rate of stirring should ensure adequate mixing of the receptor medium during the test period. Samples from each cell should be obtained at the specified times in the method within a tolerance of ±2 min. Unless the method specifies otherwise, the qualification of the apparatus has been verified when analysts determine that the test temperature and stirring rate are within their specified requirements and a satisfactory performance verification test (i.e., drug release rate) results. Unless otherwise specified in the method, degas the medium using an appropriate technique. Determine the amount of drug in the receptor medium sample aliquots using a validated analytical procedure.
The following sections provide instructions for proper use of Models A, B, and C.
test procedures: model a
With the stirring mechanism in place, fill the receptor chamber with the specified medium with the stirrers rotating and a positive meniscus covering the top of each cell. Allow time for the medium to equilibrate to the specified temperature. Stop the stirrer before placing the test sample on the cell. If necessary, saturate the membrane in the specified medium (generally the receptor medium) for 30 min. Place the membrane on the donor chamber, and invert. Apply the material to be tested into the cavity of the sample chamber, spreading the semisolid out to fill the entire cavity of the sample chamber. Place the filled sample chamber on the receptor chamber with the membrane down and in contact with the receptor medium. During this procedure it is important to ensure that there are no bubbles beneath the membrane. Then assemble the complete cell. When the assembly of all donor and receptor chambers and remaining cell components (i.e., disk, alignment ring, and clamp) have been completed, turn on the stirring device, which constitutes the start of the test or time zero. Sampling is generally performed over a 4–6 h time period. Follow the specified sampling procedure, and collect an aliquot from each cell receptor chamber for analysis. With the stirrer stopped and using a syringe, replace the withdrawn volume with stock receptor medium warmed to the specific temperature, and resume stirring. During the sampling and medium replenishment process(es), ensure that bubbles are not introduced into the cell.
test procedures: models b and c
A nonstick (Teflon-coated) stir bar is placed within the receptor chamber of the VDC. The membrane specified in the test method is clamped atop the O-ring, if present, between the aligned donor and receptor chambers of the VDC. The exposed periphery of the joint between the donor and receptor compartments is sealed (e.g., circumscribed by stretched paraffin wax film).
The receptor chamber is filled with receptor medium via the sampling arm, unless it is already filled before the membrane is mounted. The VDC assembly is tilted in multiple orientations and inspected to ensure that any air bubbles trapped beneath the membrane, or within the receptor chamber, can escape via the sampling arm port. The volume of receptor medium is adjusted to the calibrated level marked on the sampling arm port. The membrane is allowed to equilibrate with the receptor medium, in situ, for at least 30 min prior to the application of the dosage form, or may be pre-incubated with a wetting solution (typically the receptor medium), as specified in the test method.
The VDC units are positioned in a stirrer rack. It is recommended that about 10–20 cm of slack should be available in the tubing connecting the ports of the VDC water jacket to the VDC rack to facilitate subsequent manipulation of the VDC during the test. The temperature set point of the water bath is adjusted before dosing so that the membrane is at the correct temperature. This can be verified by measuring the membrane temperature before dosing, using a calibrated infrared thermometer.
The stirring is initiated and can be maintained continuously throughout the test. The dosage form is evenly dispensed directly onto the membrane surface. The amount of sample recommended is NLT approximately 1.0 mL/cm2 or 1.0 g/cm2 to ensure a pseudo-infinite dose condition. Spreading of the sample typically starts at the outer edge and proceeds in an inward spiral pattern to assure full coverage of the edges of the dose area without air gaps. The placement of the sample constitutes the start of the test or time zero. The donor chamber is subsequently sealed with an occlusive film to prevent loss of any volatile components of the test formulation. The underside of the membrane is checked for air bubbles and, if any are seen, they are eliminated by tilting the apparatus in a manner that allows the air bubbles to escape. The receptor volume is confirmed at the calibrated volume mark and adjusted as necessary.
Before sample collections, typically every hour over the 4–6 h period following the introduction of the sample, the volume in the sampling arm is confirmed approximately 10 min before sampling and is adjusted to the calibration mark on the sampling arm as necessary. At predetermined intervals after starting the test, typically hourly for 6 h, analysts collect aliquots of the receptor medium (e.g., 150 µL) via the sampling arm, drawing from the well-mixed center of the receptor chamber. The VDC assembly is inspected for air bubbles, which are eliminated as necessary. Receptor medium is replaced to bring the receptor volume back to the level indicated on the sampling arm of the VDC.
Drug Release Rate Determination Using Immersion Cell Apparatus
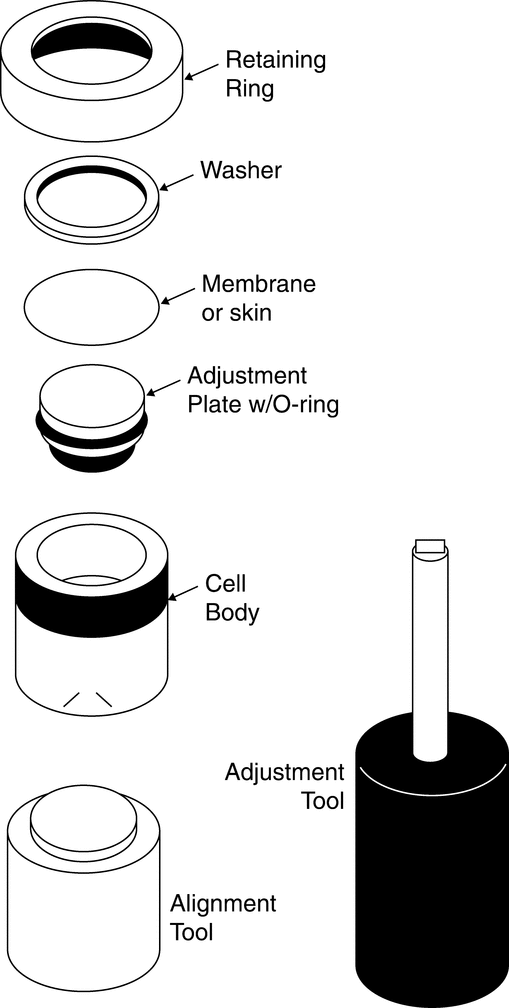
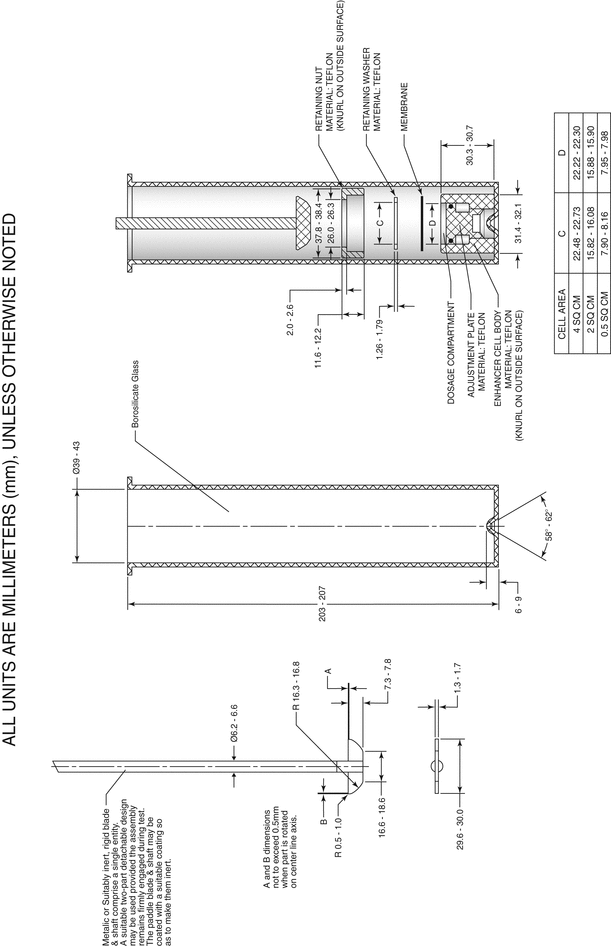
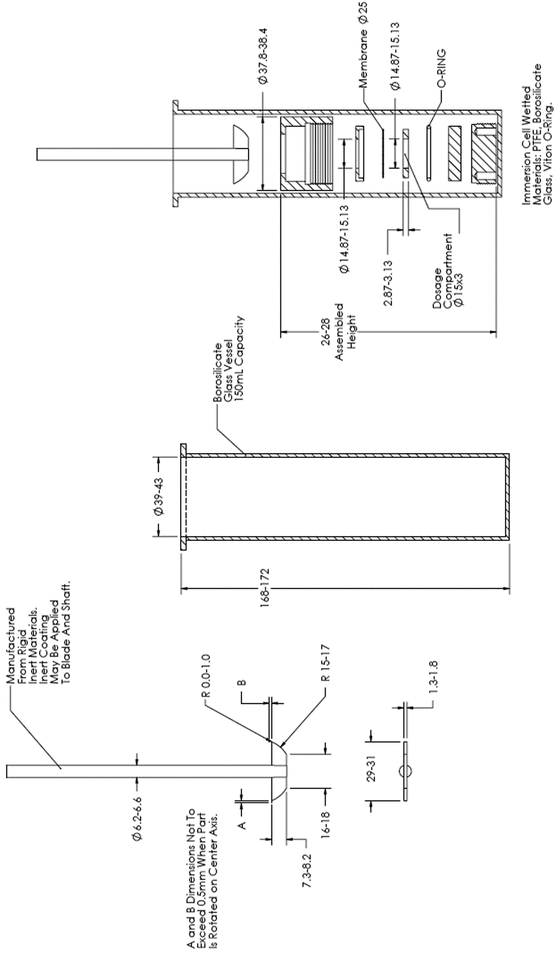
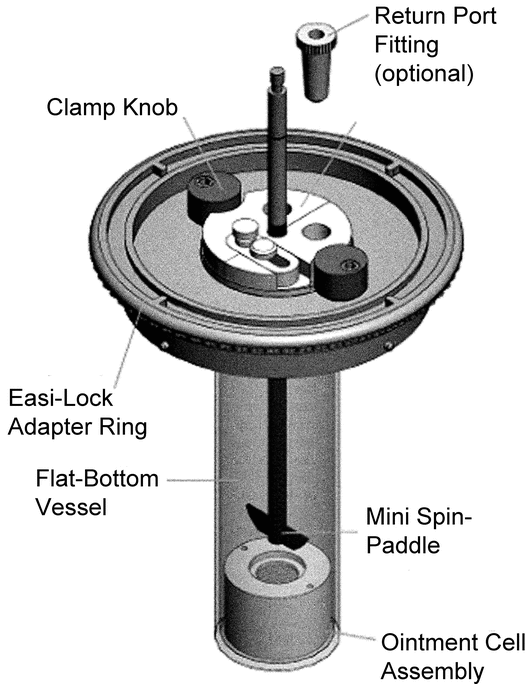
The cell consists of the following components (see Figure 4 and Figure 5 for Model A, and Figure 6 and Figure 7 for Model B): a retaining or lock ring that secures the membrane to the cell body and ensures full contact with the sample; a washer that provides a leakproof seal between membrane, retaining ring, and cell body; the membrane (usually a synthetic membrane) that should retain the sample in the sample compartment; and the cell body that provides a variable depth reservoir for the sample. Model A also has an adjustment plate that allows operators to vary the volume of the reservoir within the cell body. The plate can be placed at the appropriate height for each test and can be completely removed to facilitate cleaning. An O-ring paired with the adjustment plate prevents leakage.
The immersion cell can be used with USP Apparatus 2 (see general chapter Dissolution  711
711 ) with vessel volumes that vary from 100 mL up to 4 L, but the 150- or 200-mL vessels are the most commonly used. A flat-bottom variation of the 150- or 200-mL vessel can be used to avoid the issue of dead space under the cell when it is used in a round-bottom vessel. If analysts are going to use a 150- or 200-mL vessel with USP Apparatus 2, then the appropriate modifications must be made, including holders for the small-volume vessels and replacement of the standard paddle with the appropriate paddle. It also may require repositioning of any automated sampling device and/or manifold. The water bath or vessel heater should be set to have the medium temperature at 32.0 ± 0.5
 or 37.0 ± 0.5
 .
.
Before loading the cells and placing the medium in the vessel, set the paddle height, which is 1.0 ± 0.2 cm above the surface of the membrane. All other operational parameters, such as level, vibration, wobble, etc., should be set at the same conditions defined for USP Apparatus 2. The small-volume condition is qualified by first using the standard Apparatus 2 setup and Performance Verification Test, Apparatus 1 and 2 (see Dissolution  711
711 ).
).
Cut the membrane to an appropriate size. If necessary, soak the membrane in the receptor medium for at least 30 min before loading. If the membrane is thick, a longer soaking time period may be necessary. Prepare the immersion cell components as specified by the device manufacturer.
Fill the reservoir dosage area with the sample under test. Ensure that the reservoir is filled to the top in order to minimize the possibility of air bubble formation between the surface of the sample and the membrane. A uniform surface can be obtained with the aid of a spatula. The typical quantity of sample is between 300 mg and 2 g, depending on the type of immersion cell used. An excess of sample is needed to obtain a steady-state drug release rate. Using forceps or tweezers, remove the membrane from the soaking medium and place it over the top of the sample compartment. Ensure that the membrane is free of wrinkles. Assemble the immersion cell components as specified by the device manufacturer. Carefully place the completed assembly into the bottom of the dissolution vessel with the membrane facing up. The appropriate preheated medium may be preloaded in the vessel or can be added after immersion of the immersion cell to start the test. Samples from at least 5 time points should be obtained in the steady-state (linear) portion of the drug release profile. The data points are cumulative and expressed as concentration per surface area, typically per cm2, as a function of the square root of time. Sampling is generally performed over a 4–6 h time period. The slope of the line is the in vitro release rate of drug from the product. At the end of the test period, dismantle the cell and examine the contents for anything unusual that could explain any anomalous data (e.g., leaks, bubbles, etc.).
qualification
USP Apparatus 2 should be qualified according to the procedure described in Dissolution  711
711 .
.
Drug Release Determination Using USP Apparatus 4 (Flow-Through Cell)
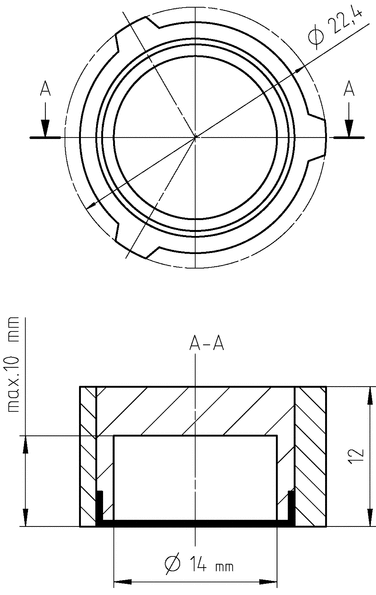
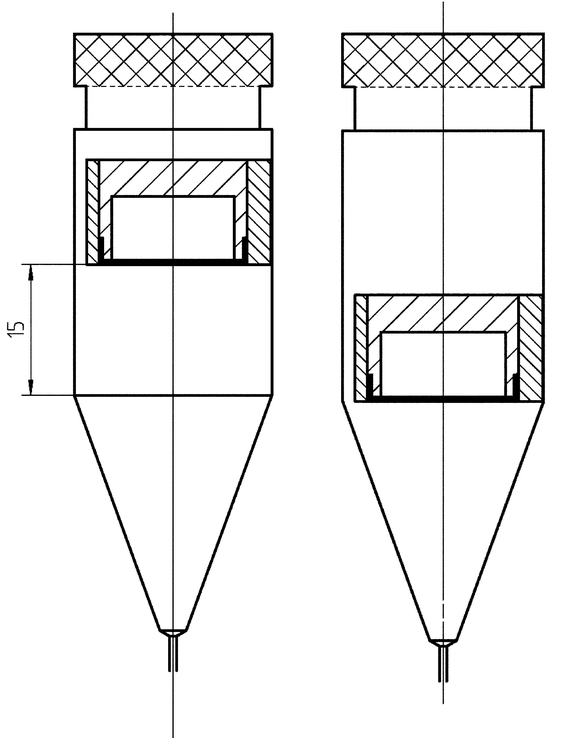
The adapter for semisolid dosage forms (see Figure 8) is used with the 22.6-mm cell of USP Apparatus 4 described in Dissolution  711
711 . The adapter consists of a reservoir and a ring to hold the membrane. The reservoir is available in different sizes that can accommodate from 400 to 1200 µL of product. The use of the USP Apparatus 4 cells ensures control of temperature and hydrodynamics. The temperature can be maintained either at 32.0 ± 0.5
 or 37.0 ± 0.5
 , depending on the intended site of the administration of the formulation. The flow rate should comply with the requirements of Dissolution
  711
711 with a sinusoidal flow profile with a pulsation of 120 ± 10 pulses/min and a precision of ±5% of the nominal flow rate.
Procedure
The membrane, which may be soaked in the receptor medium beforehand, is loaded in the membrane ring using the provided tool. The membrane should be large enough to overlap the top edge of the reservoir body with a diameter of 18 mm. The sample is loaded into the reservoir. The other side of the tool can be used to hold the reservoir while loading the sample. If necessary, the excess of sample can be removed using a spatula. Screw the membrane ring onto the sample reservoir. Ensure that the membrane is free of wrinkles while screwing.
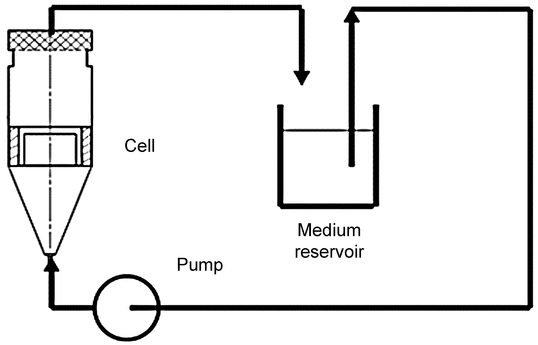
Remove the semisolid sample adapter from the tool, and slide it into the cylindrical part of the 22.6-mm cell with the membrane facing downward. Vertical positioning within the cell can be adjusted using the tablet holder scoring, if desired (see Figure 9). If the lower position is chosen, release can be higher due to the proximity to the flow inlet. The system is typically configured as a closed system (see Figure 10), but in some cases, an open system can be used. The prepared cell is inserted in a heating jacket.
Figure 9. Vertical positioning of the insert using the tablet holder scoring (all dimensions are in mm).
The defined volume of release medium is introduced in the reservoir. Unless otherwise specified, the medium should be deaerated in order to minimize the risk of air bubbles. A deaeration procedure is described in Dissolution  711
711 , but other validated deaeration techniques can be used. The reservoir can be adapted to the volume needed in order to achieve sink conditions and to ensure precision of the analytical method. Typical volumes range from 50 to 1000 mL, but values above and below this range also can be used as the formulation demands.
When the pump is switched on, the medium will be pumped through the cell. This represents the time zero of the test. Typical flow rates are 16 mL/min and 24 mL/min, but flow rate is a method-development parameter and must be optimized accordingly. The flow passing through the cell ensures both agitation and renewal of the receptor medium at the interface with the membrane.
Sampling can be performed either manually or automatically directly from the medium reservoir, thus ensuring no interference with the flow cell and its contents. An automated fraction collector may be appropriate for release periods longer than 6 h. After quantification, plot the amount of drug release per surface area versus the square root of time, with the slope of the line representing the in vitro release rate.
Calculation of Rate and Amount of Drug Released
Calculate the drug release rate using the following steps.
Amount released (µg/cm2) at a given time (t1, t2, etc.) (ARi) is calculated for each sample:
Amount released at t1AR1 = (AU1/AS) × CS × 1000 × (VC/A0)
Amount released at t2AR2 = (AU2/AS) × CS × 1000 × (VC/A0) + [AR1 × (VS/VC)]
AR = amount of drug released (µg/cm2)
AU = response (e.g., peak area, or peak height or absorbance) from the Sample solution
AS = average response (e.g., peak area, or peak height or absorbance) from the Standard solution
CS = concentration of the Standard solution (mg/mL)
VC = volume of the diffusion cell (mL)
AO = area of the orifice (cm2)
VS = volume of sample taken (mL)
For each cell, the individual amount of drug released is plotted versus the square root of time. The slope of the resulting line is the rate of drug release. The average of 6 slopes for each test and reference products represents the drug release rate of the dosage form, and serves as the standard for the drug product.
Application of Drug Release
The product performance test can be used to assess sameness of the drug product after post-approval changes. Because common testing artifacts, such as air bubbles and membrane defects, yield measurements that are not normally distributed, a nonparametric statistical technique is used to evaluate the test results. The Mann-Whitney U test is used to calculate the 90% confidence interval for the ratio of the slopes between the test and the reference batches. This is illustrated by the following example in which the initial drug product batch is referred to as the reference batch (R) and the changed or subsequent batch is referred to as the test batch (T). The individual amounts of drug released from R is plotted versus time, and the resulting slopes are determined. Those are the reference slopes. The process is repeated for the test batch (T).
The T/R slope ratios are calculated for each test-to-reference slope. This procedure is facilitated with a table where the values for the slopes for test and reference batches are listed down the left side and across the top of the table, respectively. The T/R slope ratios are then determined. See Table 1.
Table 1. Comparison of Test and Reference Slopes
| RS1 | RS2 | RS3 | RS4 | RS5 | RS6 | |
|---|---|---|---|---|---|---|
| TS1 | TS1/RS1 | TS1/RS2 | TS1/RS3 | TS1/RS4 | TS1/RS5 | TS1/RS6 |
| TS2 | TS2/RS1 | TS2/RS2 | TS2/RS3 | TS2/RS4 | TS2/RS5 | TS2/RS6 |
| TS3 | TS3/RS1 | TS3/RS2 | TS3/RS3 | TS3/RS4 | TS3/RS5 | TS3/RS6 |
| TS4 | TS4/RS1 | TS4/RS2 | TS4/RS3 | TS4/RS4 | TS4/RS5 | TS4/RS6 |
| TS5 | TS5/RS1 | TS5/RS2 | TS5/RS3 | TS5/RS4 | TS5/RS5 | TS5/RS6 |
| TS6 | TS6/RS1 | TS6/RS2 | TS6/RS3 | TS6/RS4 | TS6/RS5 | TS6/RS6 |
After the T/R ratios have been calculated, they are ordered from the lowest to the highest. The 8th and 29th T/R ratios are identified and converted to percent (multiplied by 100). These values represent the 90% confidence interval for the ratio of test to reference release rates. To pass first stage testing, those ratios must be within the range of 75%–133.33%.
If the results do not meet this criterion, four additional tests of 6 cells should be performed, resulting in 12 additional slope determinations for each product tested. The T/R slope ratios for all 18 slopes for each product tested are determined. All 324 individual T/R slope ratios are ordered from the lowest to the highest. To pass this second stage testing, the 110th and 215th slope ratios, representing the 90% confidence interval, must be within the range of 75%–133.33%.
Auxiliary Information—
Please check for your question in the FAQs before contacting USP.
| Topic/Question | Contact | Expert Committee |
|---|---|---|
| General Chapter | Margareth R.C. Marques, Ph.D.
Senior Scientific Liaison (301) 816-8106 |
(GCDF2010) General Chapters - Dosage Forms |
USP38–NF33 Page 1625
Pharmacopeial Forum: Volume No. 38(3)


